
Revealing Political Bias
A Macroanalysis of 8,480 Herblock Cartoons
Abstract
In the space of a single week in March 1951, the Washington Post’s political cartoonist Herbert Block, better known by his nom de plume “Herblock,” received plaudits from two of the nation’s most prominent liberals. “I have long admired your work,” declared the noted Harvard historian Arthur M. Schlesinger, Jr., in a letter dated March 1, “both from an artistic point of view and as a cogent expression of political and social liberalism.”1 Five days later, Chester Bowles, the former governor of Connecticut, sent Block a letter congratulating him on the consistent quality of his work. “I honestly do not know anyone in the publication field or radio field,” he wrote, “who is presenting a liberal viewpoint more effectively and consistently than you.”2 Despite these high-profile testaments to his liberal credentials, Block was adamant that his cartoons reflected no specific political agenda and that he was politically neutral. In a 1959 interview with the journalist Henry Brandon, Block was asked if he found it “easier to draw cartoons with the Democrats in office or out of office.” He answered by declaring that he didn’t “think it makes much difference” as his cartoons were “independent” of which party was in power at any given time.3
Block’s cartoons were not created simply for his own self-edification. Because of their ability to appropriate multiple cultural and emotional symbols in their efforts to visualize collective attitudes around events, nations, and individuals, Block’s cartoons engaged with what Benedict Anderson has described as an “imagined political community”—a public that shared a common set of assumptions and desires that was connected to each other, not through personal interactions, but through their readership of these cartoons.4 Block created his cartoons for a readership that was largely made up of the white, northern, white-collar, and male readership he believed to be the primary consumers of the news and editorial pages of the Washington Post. It was on this readership that Block’s cartoons worked to create, disseminate, and strengthen a set of assumptions and ideals about the world in which they inhabited. By understanding the implicit and explicit biases of Block’s cartoons, and the extent to which he held himself to his own standards of impartiality, we can more clearly understand how those cartoons informed the opinions of his readers.
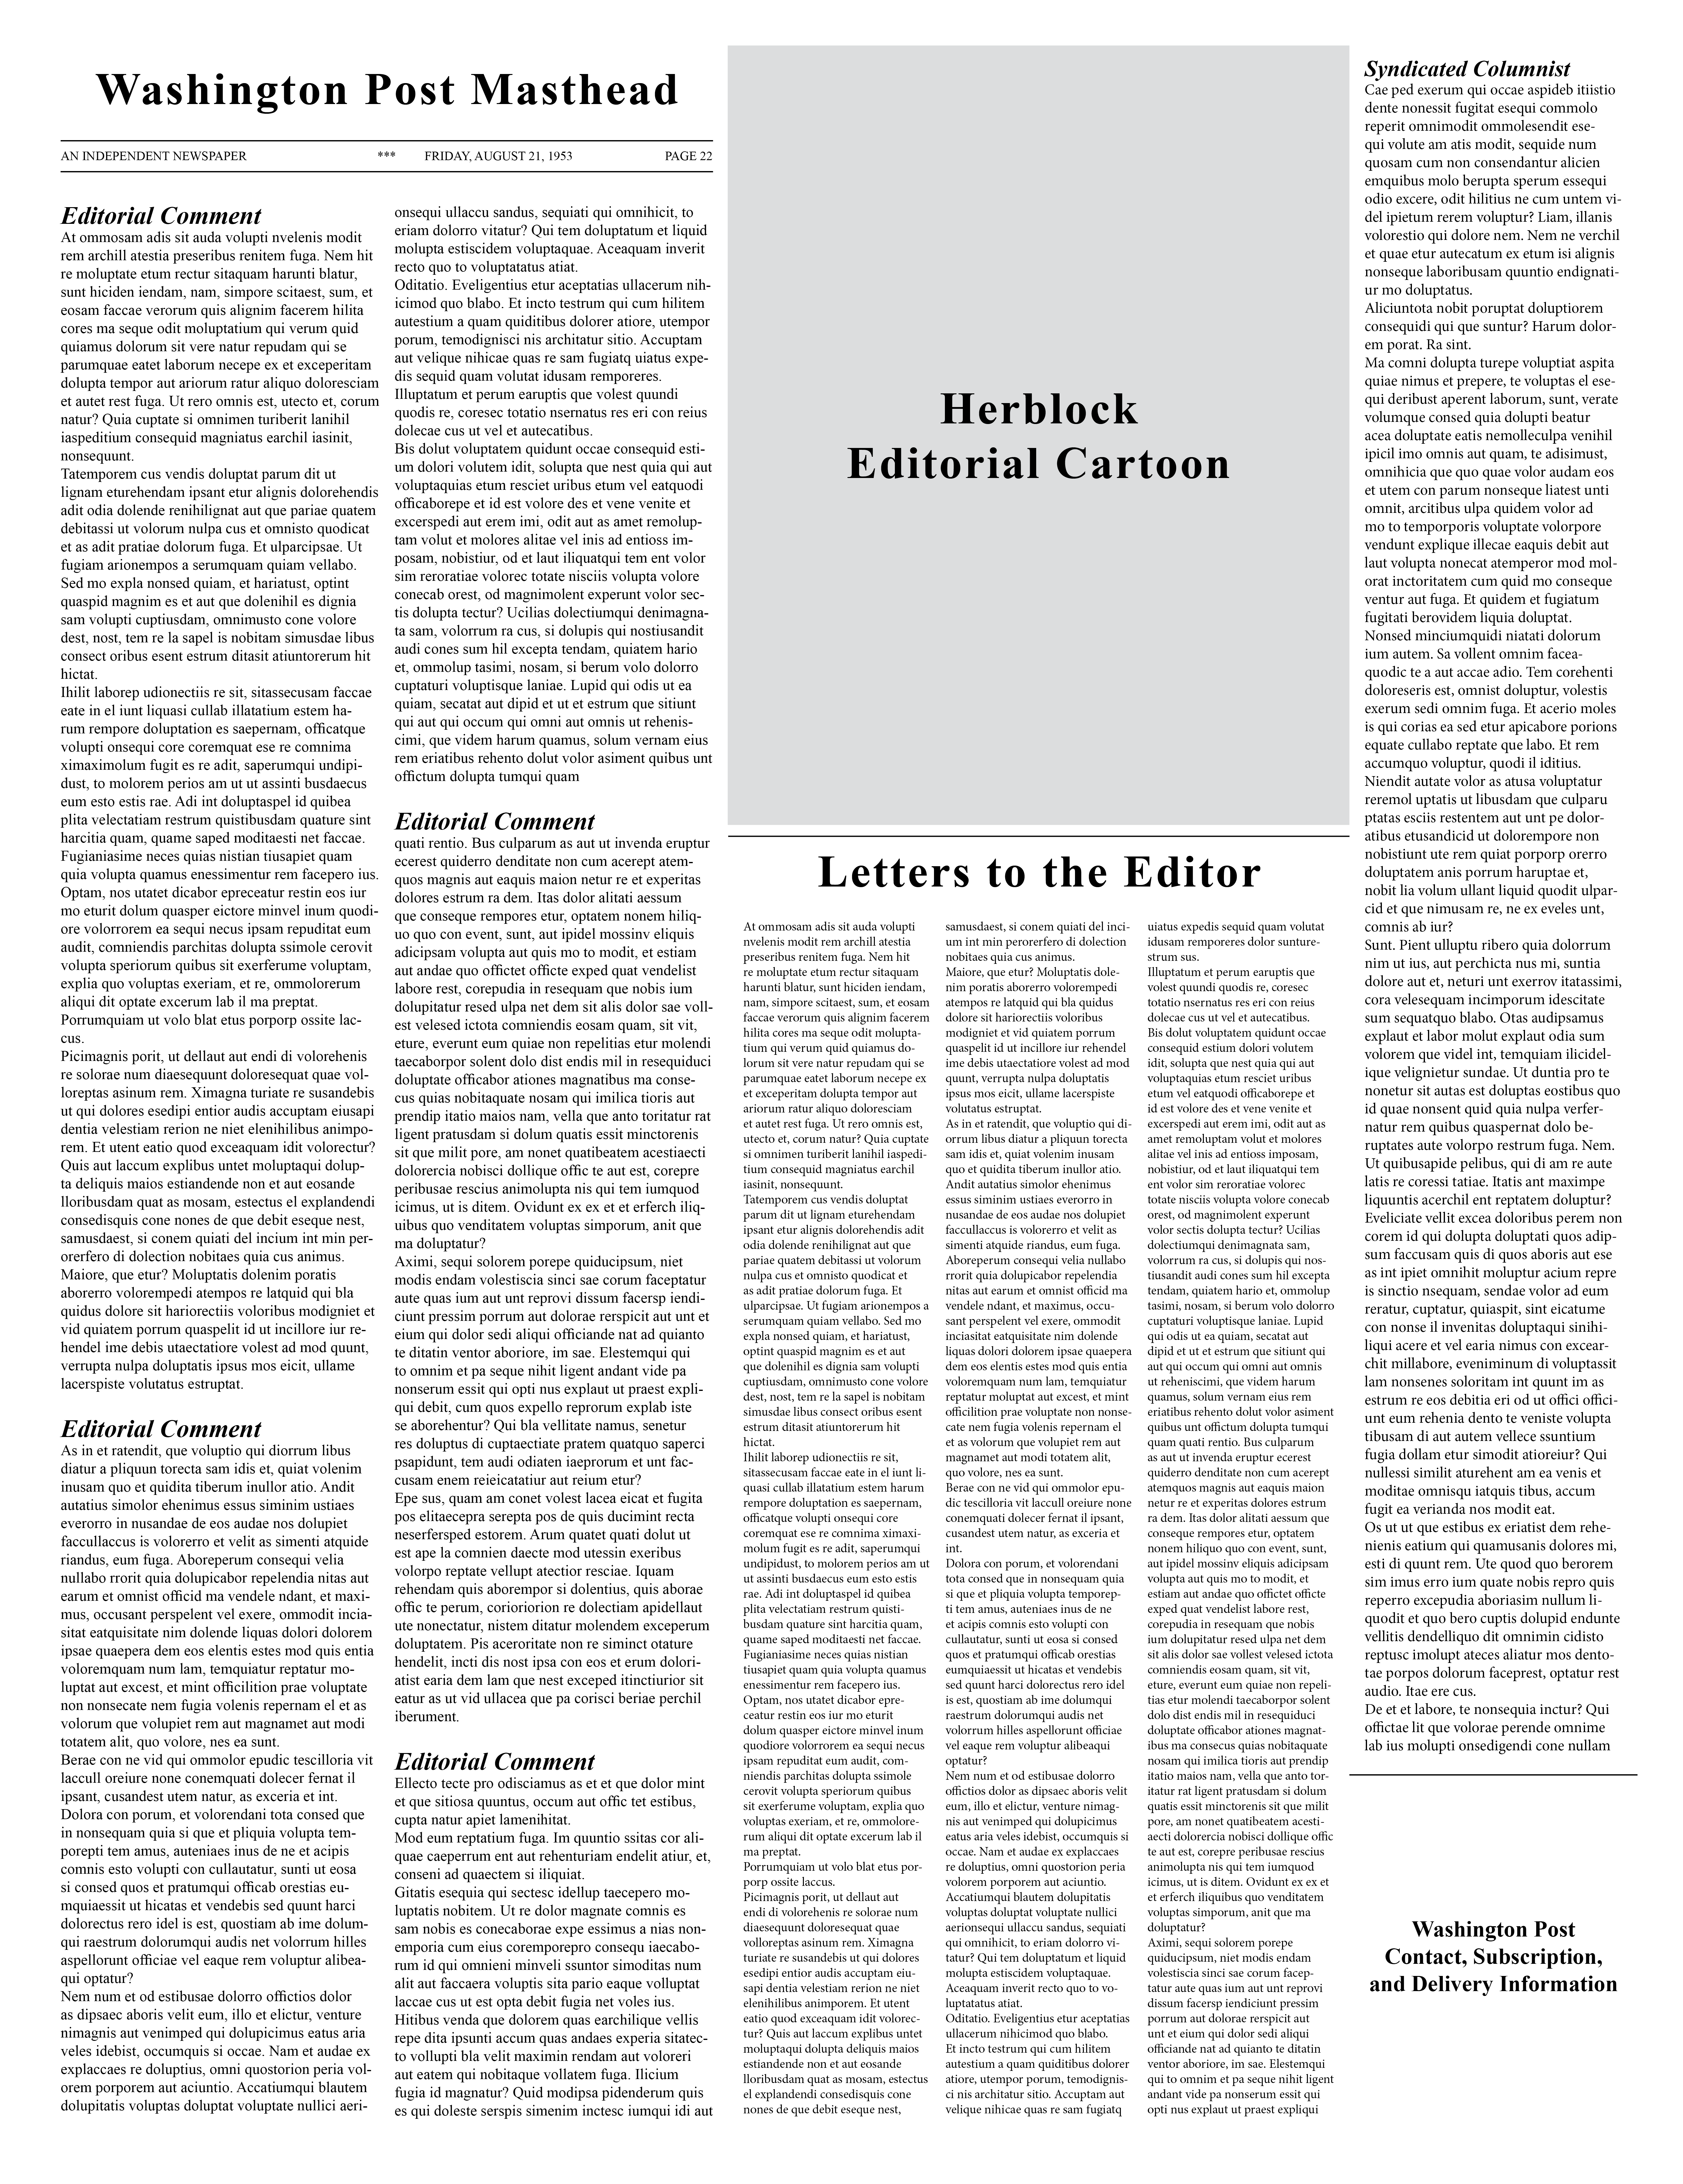
Although Block’s cartoons formed just one element of the Washington Post’s editorial page, appearing alongside both editorials and readers' letters, they were given special prominence. Johanna Drucker’s has argued that “we see before we read…[which] predisposes us to reading according to specific graphic codes before we engage with the language of the text.” This insight clarifies how the spatial arrangement of text, headlines, and images on a newspaper’s editorial page provide the reader with visual clues as to how that page should be read.5 With this in mind, figure 1 shows a generic representation of the layout of the Washington Post’s editorial page. The focus is intended to be on the two left-hand columns of editorials that extend vertically across the length of the page. The placement of Block’s cartoon in the center-top of this page, however, inevitably draws the reader’s eye to this graphic element, granting it precedence over the textual elements of the page. Consequently, Block’s work had the opportunity to influence the reader’s understanding of the day’s events before other editorial content in the newspaper was read and contemplated. Was this prominence accompanied by an unbiased handling of differing political opinions?
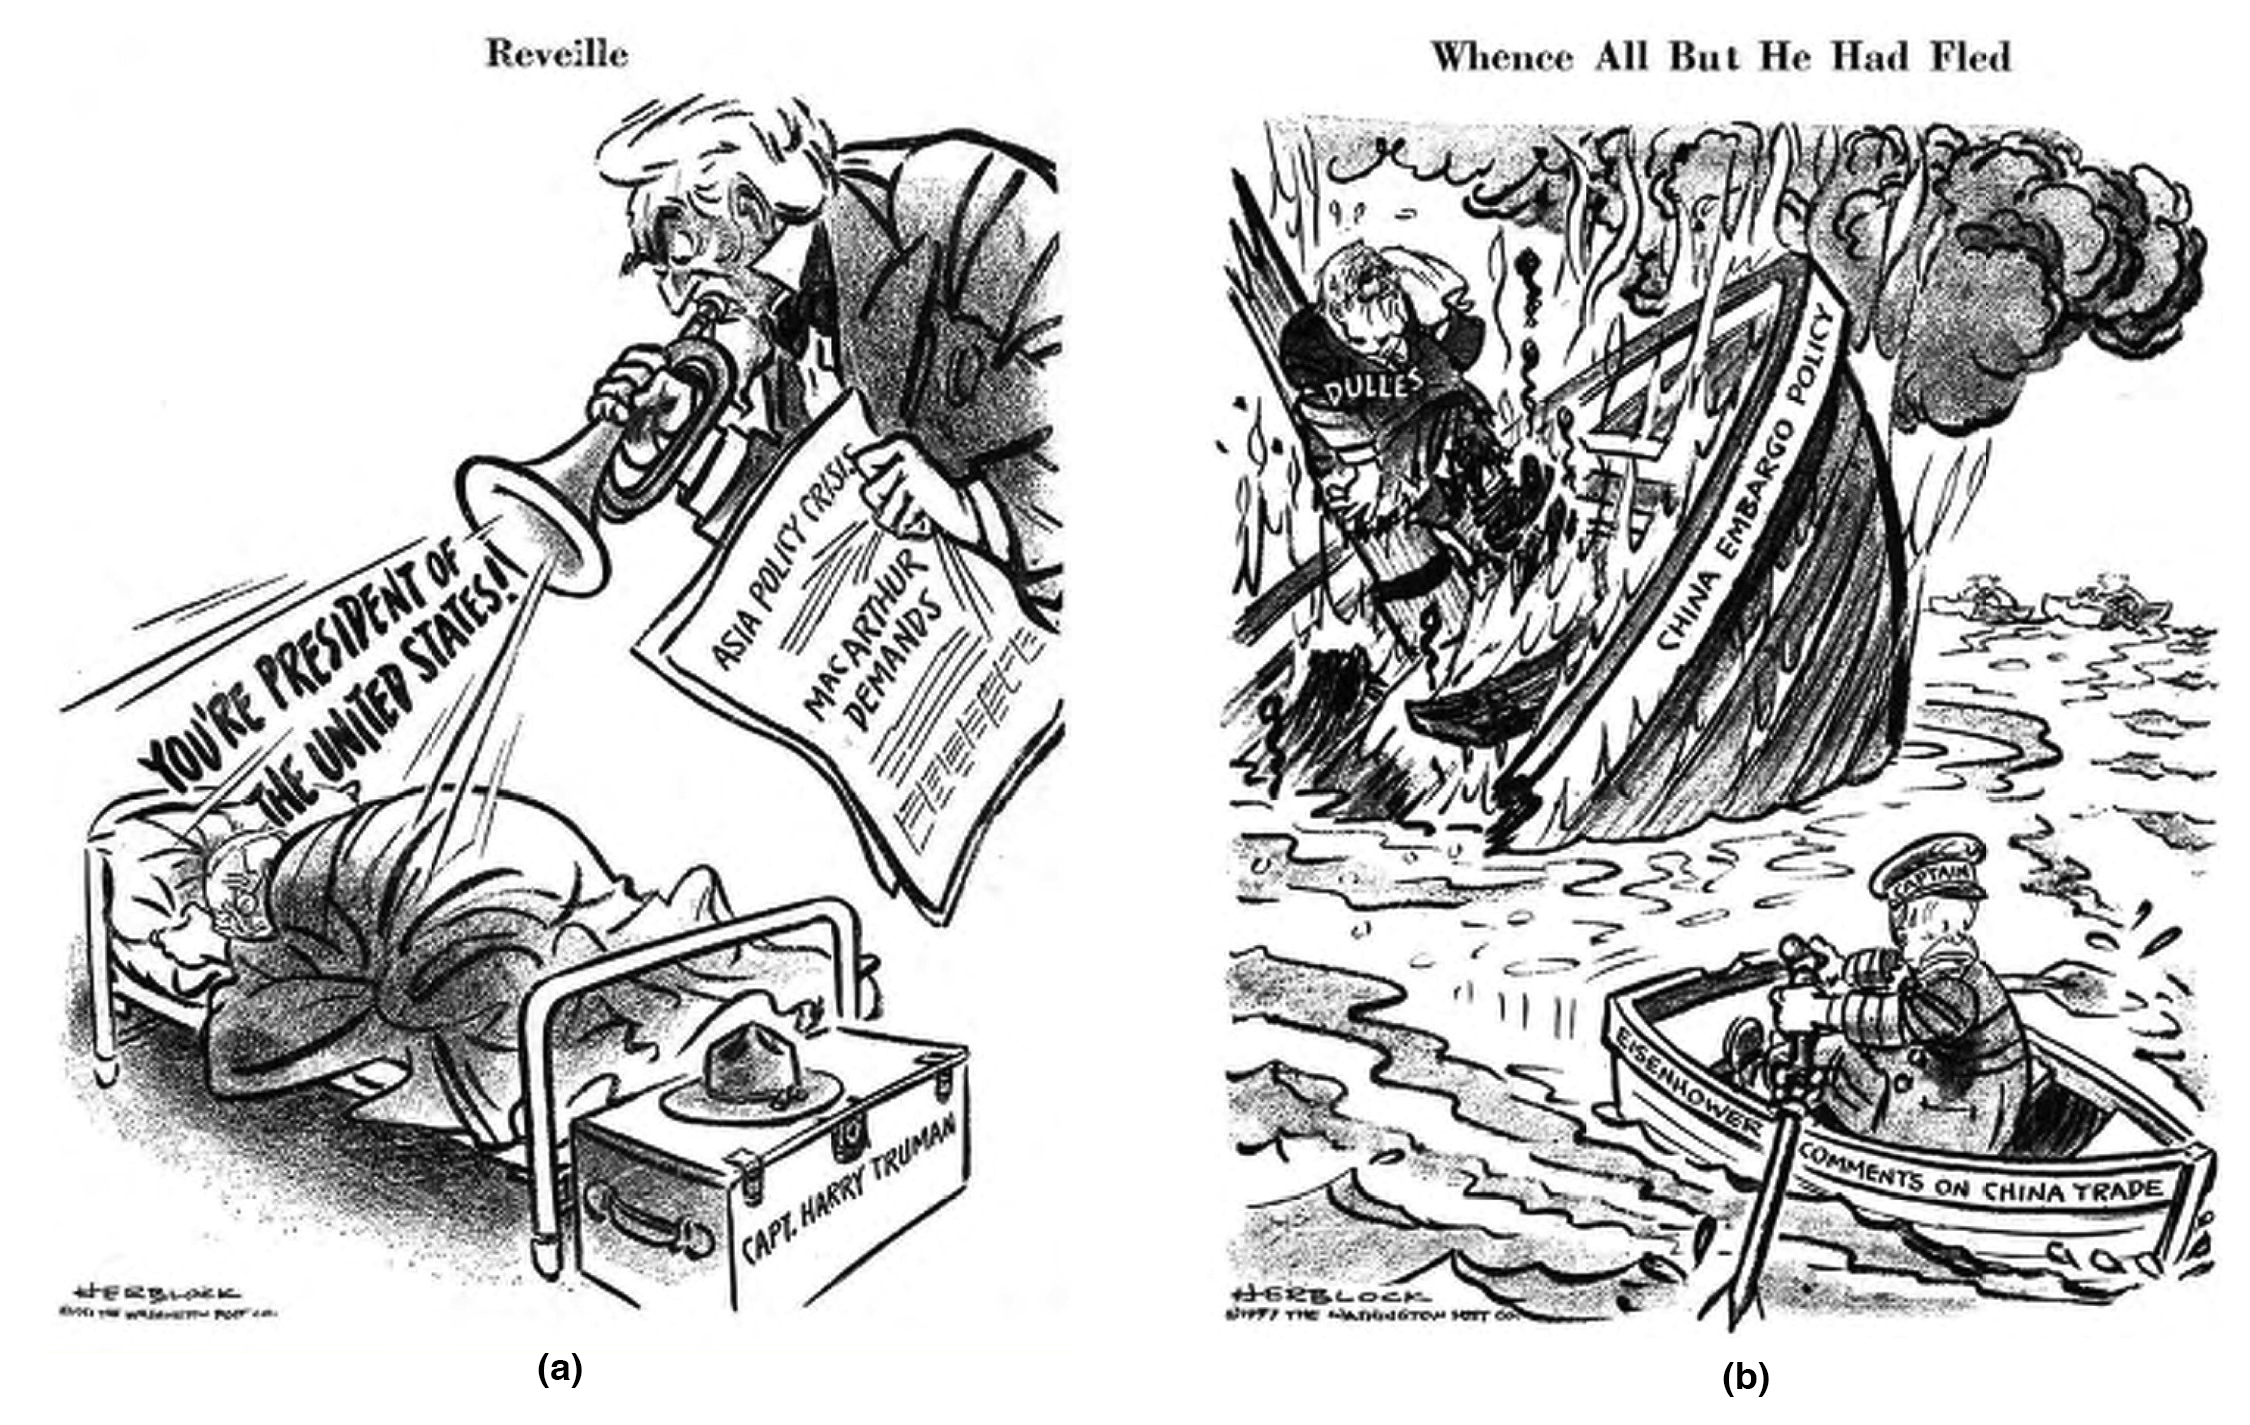
Block may have insisted that his work was unbiased, but his contemporaries—as evidenced by both the praise of such luminaries as Schlesinger and Bowles and the reactions of his readers—and later commentators have been almost unanimous in their assessment that his cartoons reflected a strong liberal ideology. At the level of individual cartoons, however, it is certainly easy enough to find examples that would seem to demonstrate that, while he may favor the individual policies of one party over the other, Block nonetheless was even-handed in his depiction of each party. For example, Block’s April 11, 1951 cartoon “Reveille” condemns Truman’s handling of General Douglas MacArthur’s public criticism of his administration’s policies during the Korean War, while June 10, 1957’s “Whence All But He Had Fled” is equally critical of Eisenhower’s trade policies with China (figure 2).6 By considering all 8,480 cartoons drawn by Block between 1946 and 1976, we can understand not only the extent to which this “independence” was maintained across multiple years and election cycles, but more importantly how his liberal ideology shaped the perhaps unconscious decisions that informed how he chose to depict specific issues, events, and administrations.
A straightforward place to start is the frequency with which members of different political parties appeared in Block’s cartoons. This metric is useful because it allows us to understand the changing focus of Block’s work. Between 1946 and 1976, 2,176 cartoons featured a character that represented either a member of the Republican Party, versus 1,192 cartoons with at least one Democrat.7 Breaking these totals down by year reveals patterns that provide further insight. In fact, the only periods in which Democrats appeared more frequently than Republicans were during those years in which a Democrat was President (figure 3). This is not a surprise. The party in power provided an opportunity for Block to draw not just presidents, but also vice presidents, secretaries of state, and other cabinet members. It is therefore natural that we would see a change in emphasis that matches the changes in administration. Even so, there is a clear bias towards depicting Republicans. The lowest percentage of depicted Republicans during a Republican administration is the 26% drawn in 1969. This is comparable to the highest percentage of Democrats drawn during a single year of a Democratic administration—28.7% in 1952, an election year in which the incumbent president did not seek reelection as the Democratic Party’s nominee.
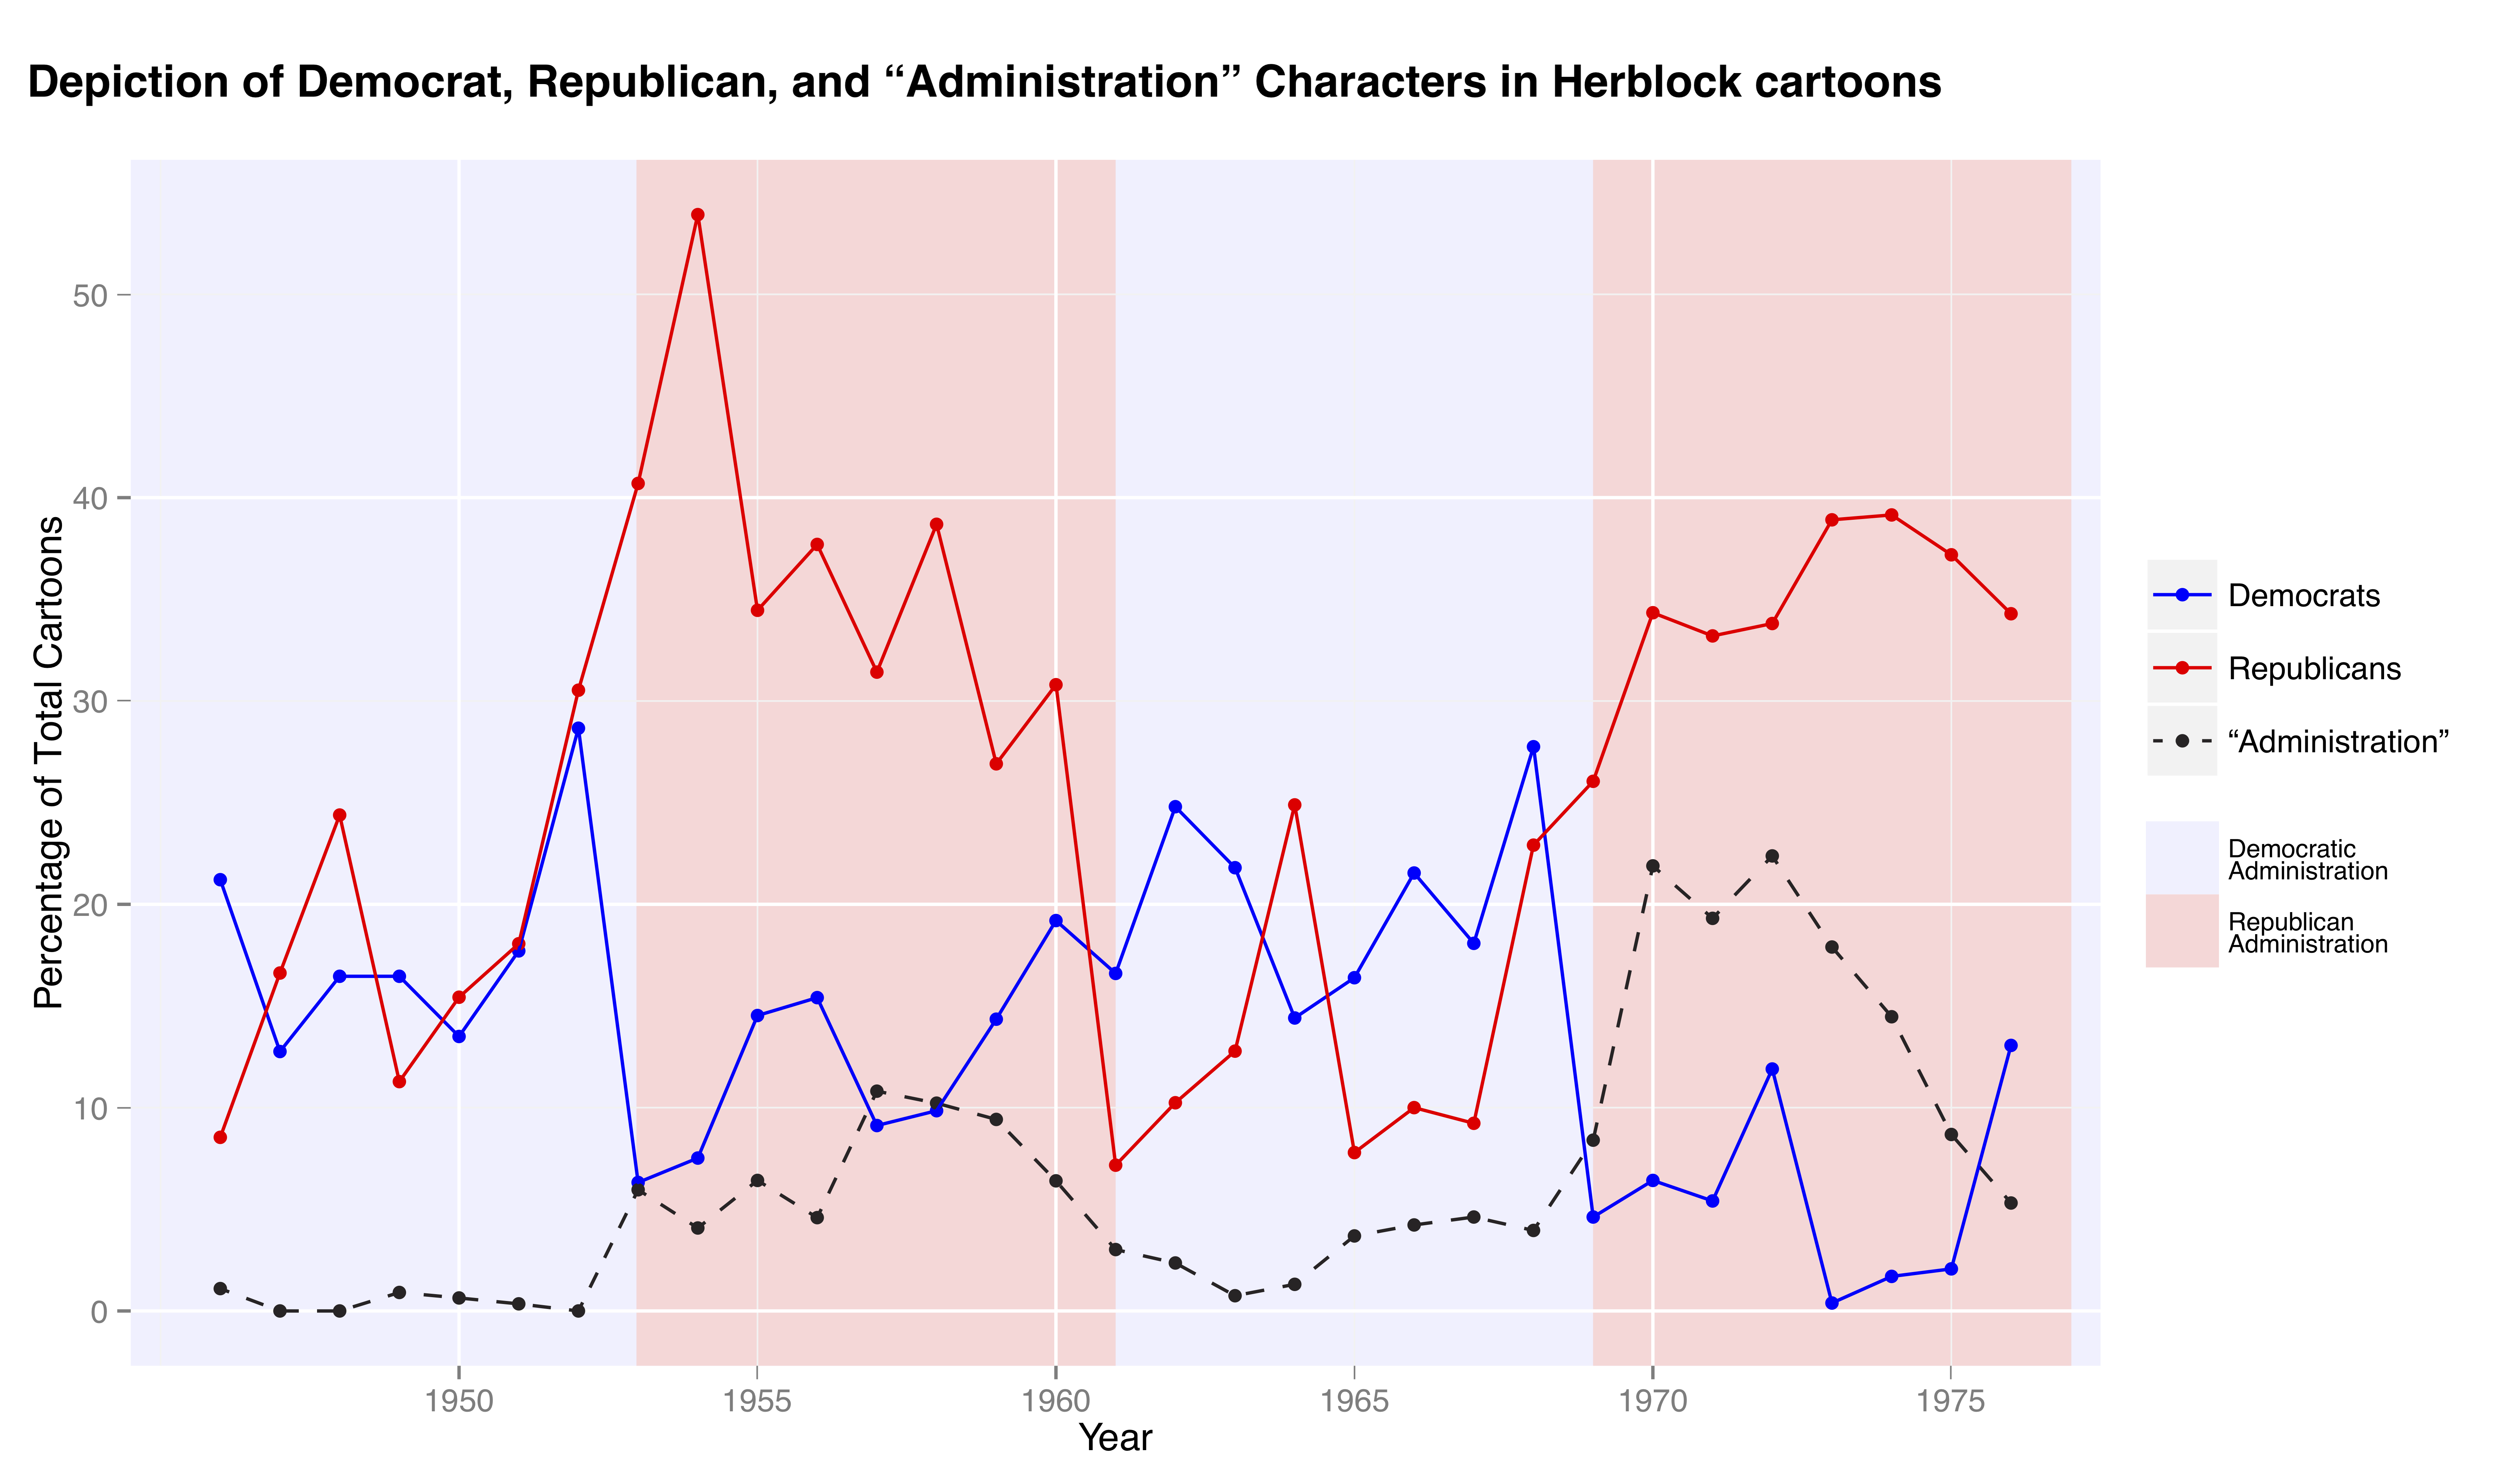
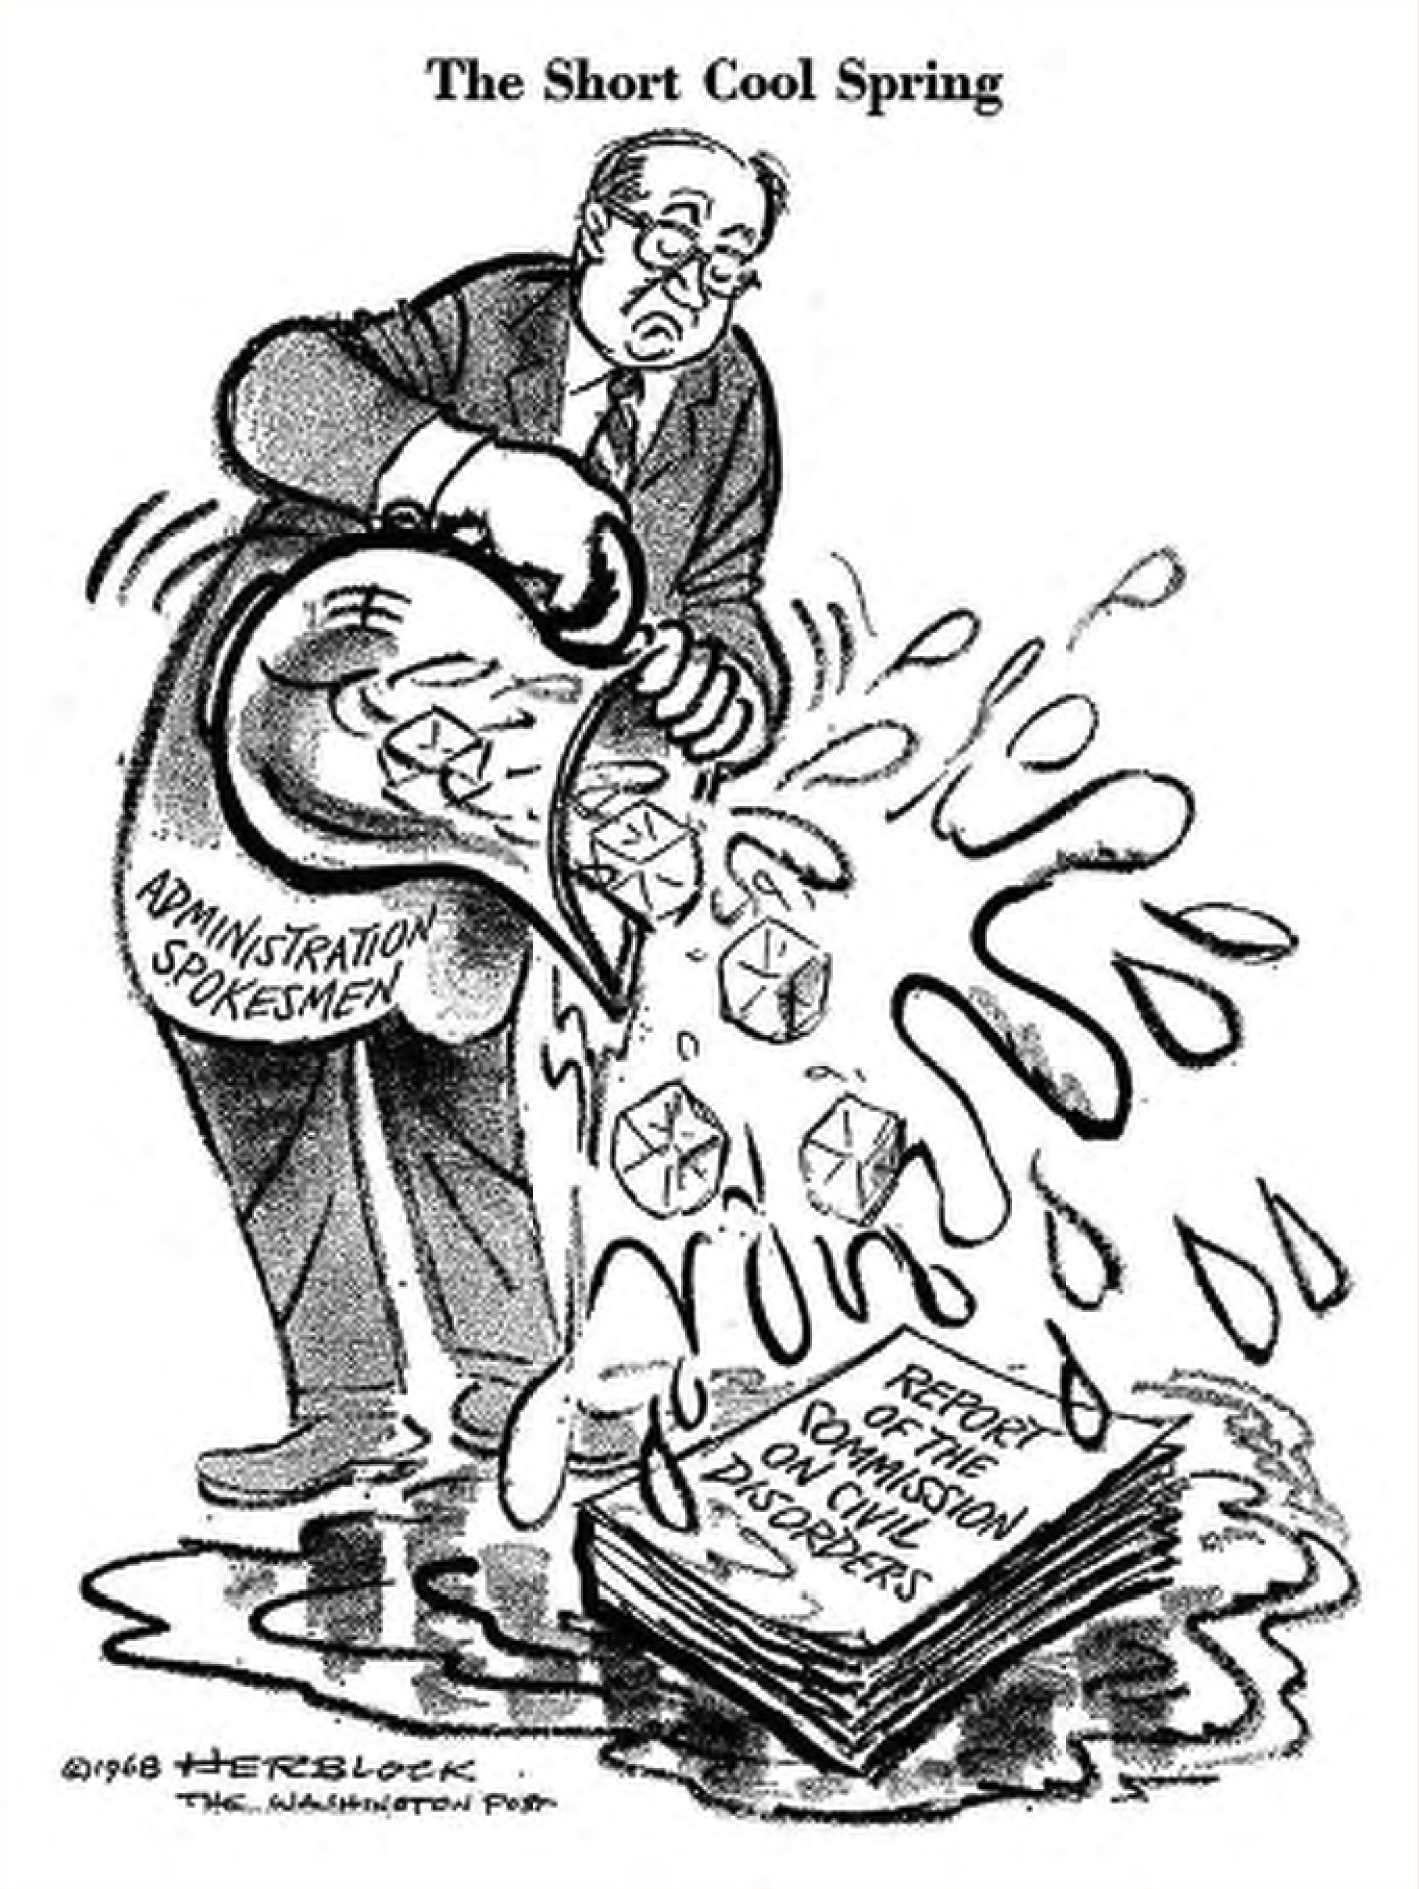
One possible explanation for these differences is that Block shied away from depicting real members of a Democratic Administration in a negative light, instead choosing to voice any displeasure he might feel about a policy without mentioning a specific official. Yet if that were the case, we would expect Block to draw generic characters representing the administration more frequently under Democratic presidents than he did under Republicans. Block’s depiction of the “Administration,” a character typically imagined as a nameless, often balding, bureaucrat who represented the actions or interests of the White House without showing a specific member of the administration, follows an exactly opposite trend to this expectation.8 The black dashed line in figure 3 represents the frequency with which this character appeared in Block’s cartoons and suggests there is some relationship between the party in power and the frequency with which the generic Administration character was drawn. By calculating correlation coefficients of the frequency with which each of these three factors appeared across the corpus of cartoons, we can understand the extent to which the occurrence of the “Administration” character is connected to an administration’s party.9 The correlation coefficient between Republicans and the “Administration” character is 0.52, suggesting that a positive relationship exists between the two variables. In contrast, the coefficient for Democrats and “Administration” is -0.68. These results indicate that the “Administration” character was more likely to be drawn during a Republican Presidency and less likely when a Democrat occupied the White House. While these values are relatively strong, they are affected by such factors as the total number of cartoons drawn each year and especially by the impact of presidential elections.
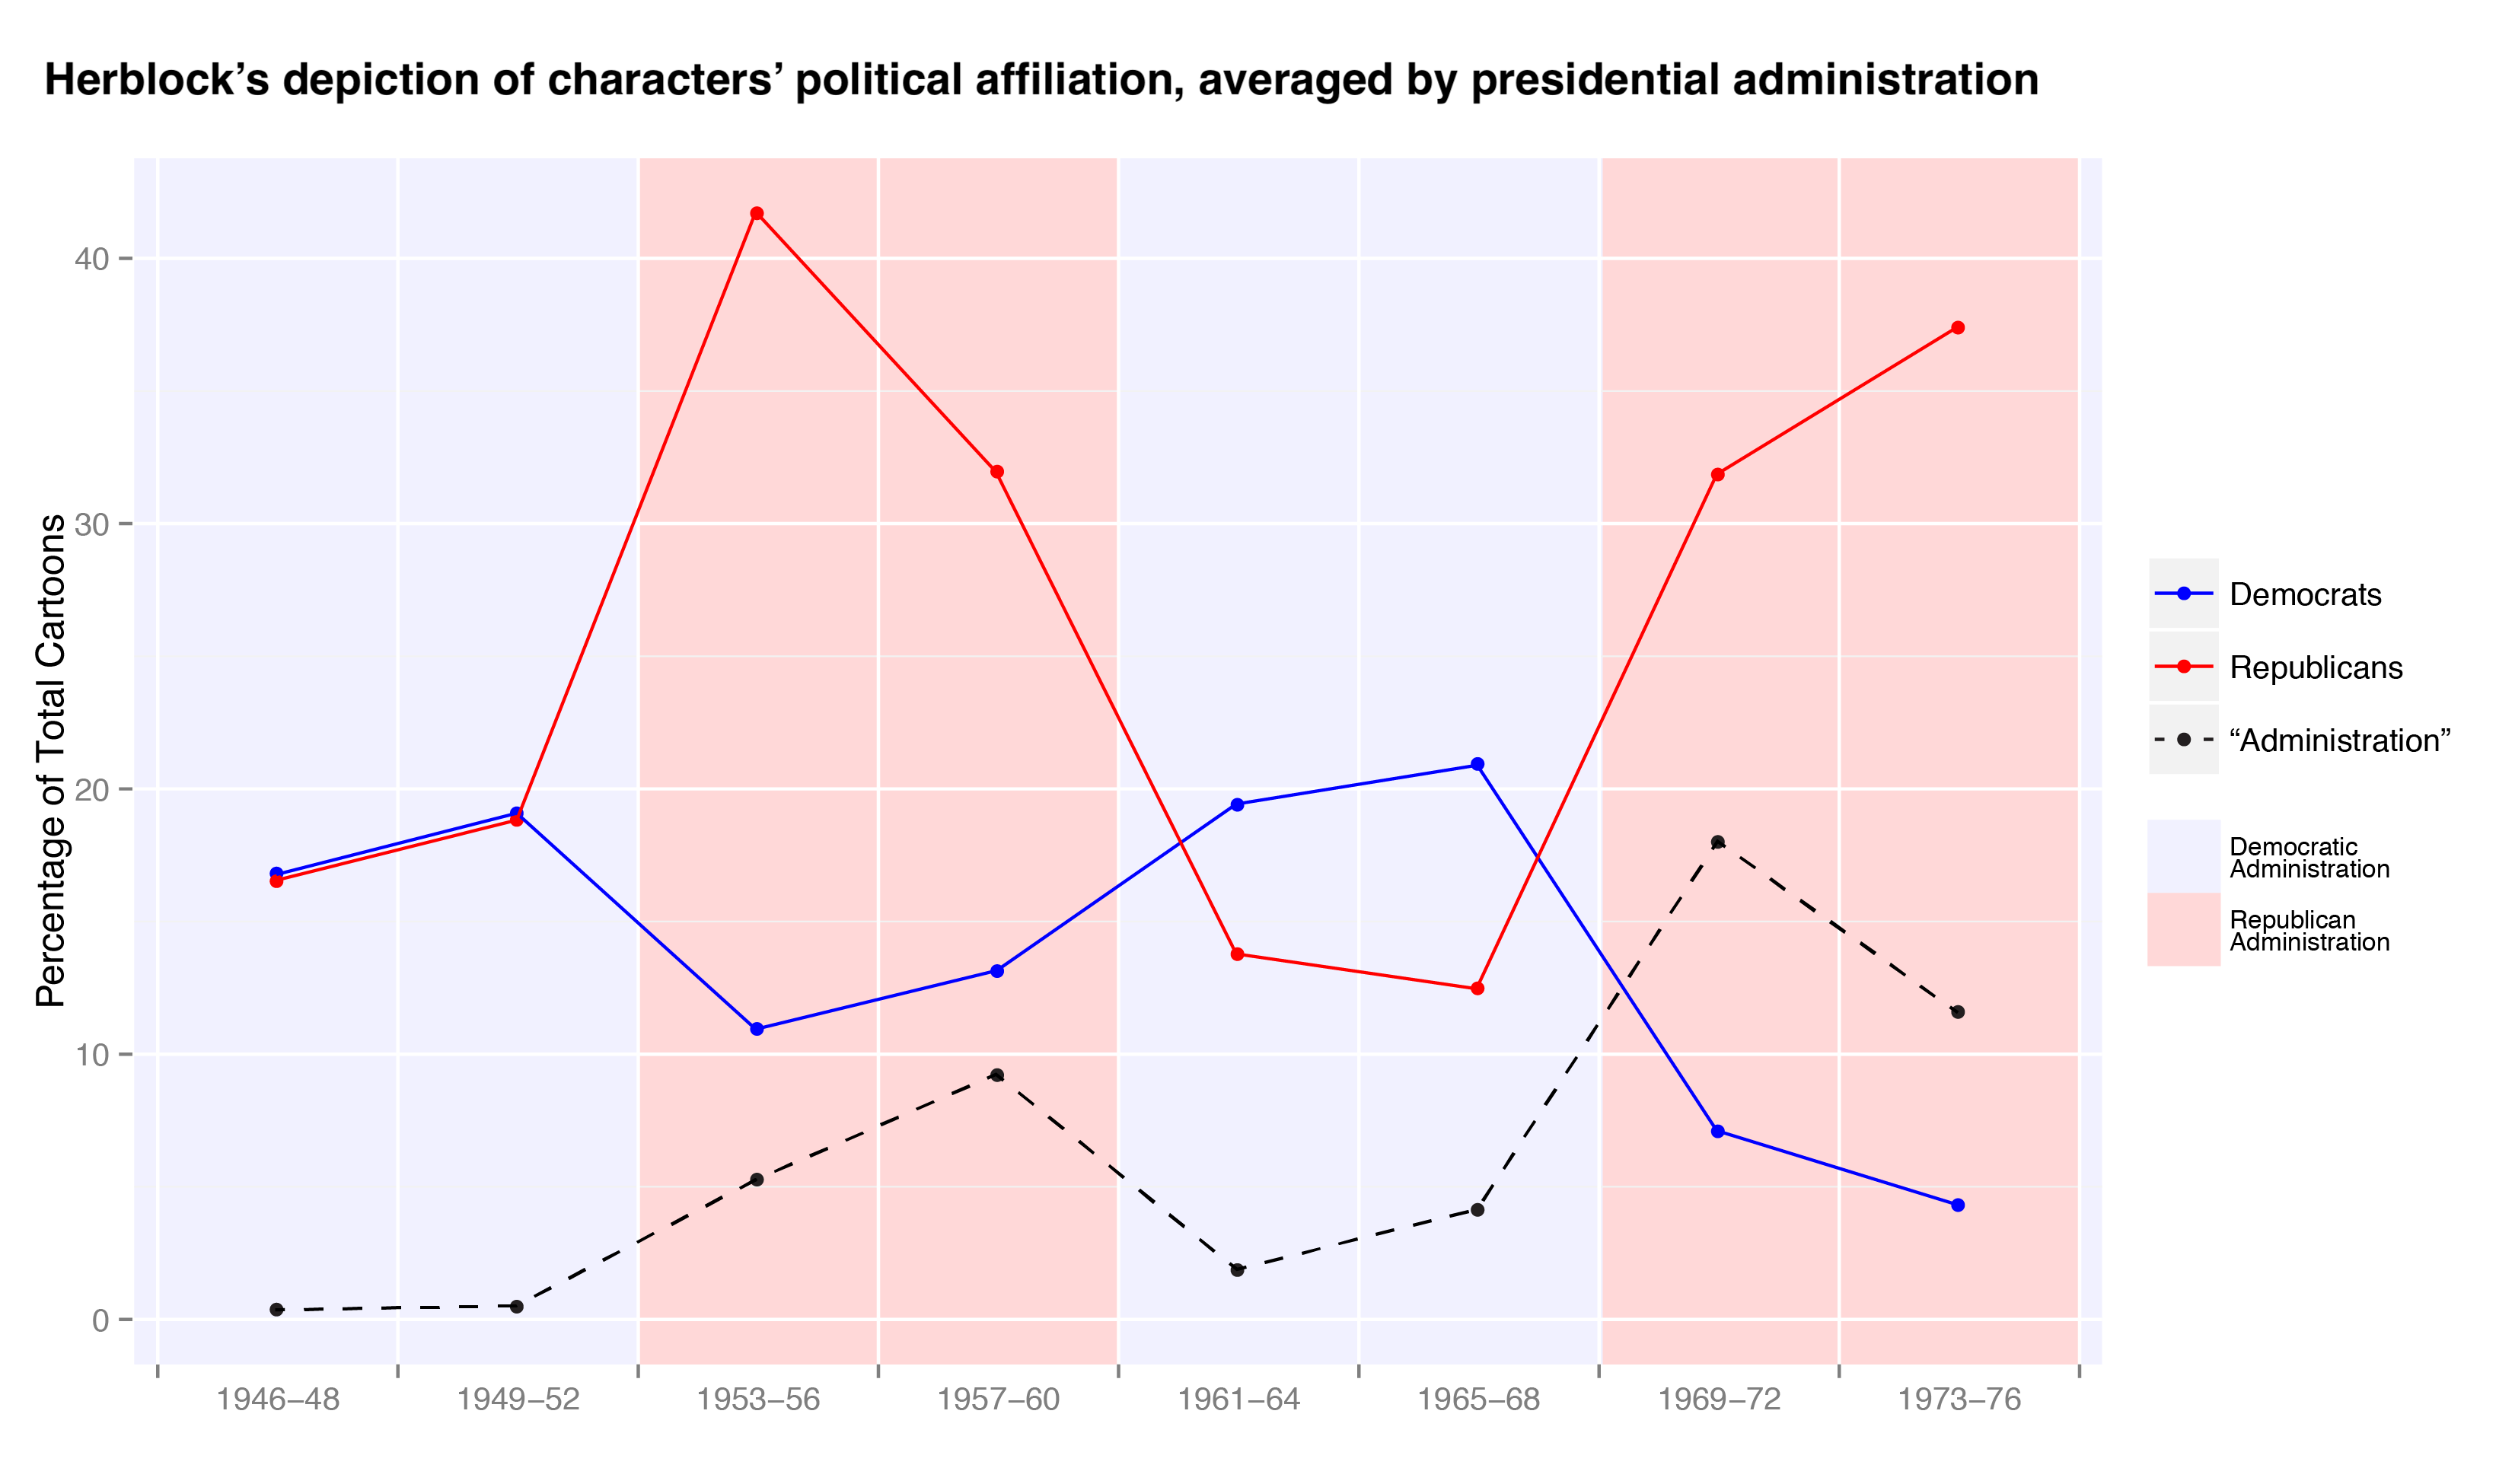
To compensate, we can calculate the average number of times that each variable appears across each four-year administration. Several key insights into Block’s portrayal of members of each major political party are revealed in figure 5. During the Truman Administration, the average count for the depiction of Democrats and Republicans is almost identical and it is after Eisenhower’s election that Block’s depiction of the two parties permanently diverges. It also becomes clearer how the president’s party affiliation affects the average count. Although the overall portrayal of Democrats is fairly consistent at between 10% and 20% of Block’s total output for each administrative period, there are clear drops in this figure each time a Republican won office. Recalculating the correlation coefficient between Republicans and the “Administration” character shows an increase in this value to 0.63; when recalculated for depictions of Democrats and “Administration”, the negative correlation increases to −0.82. Compensating for the arbitrary division of time into twelve-month periods better reveals the nature of Block’s portrayal of partisan actors in his cartoons and suggests how the generic “Administration” character, which could have been used by Block as a proxy representation of a presidential administration to criticize a President’s policies, was in fact more commonly used during Republican Administrations to reinforce his criticism of that party’s policies.
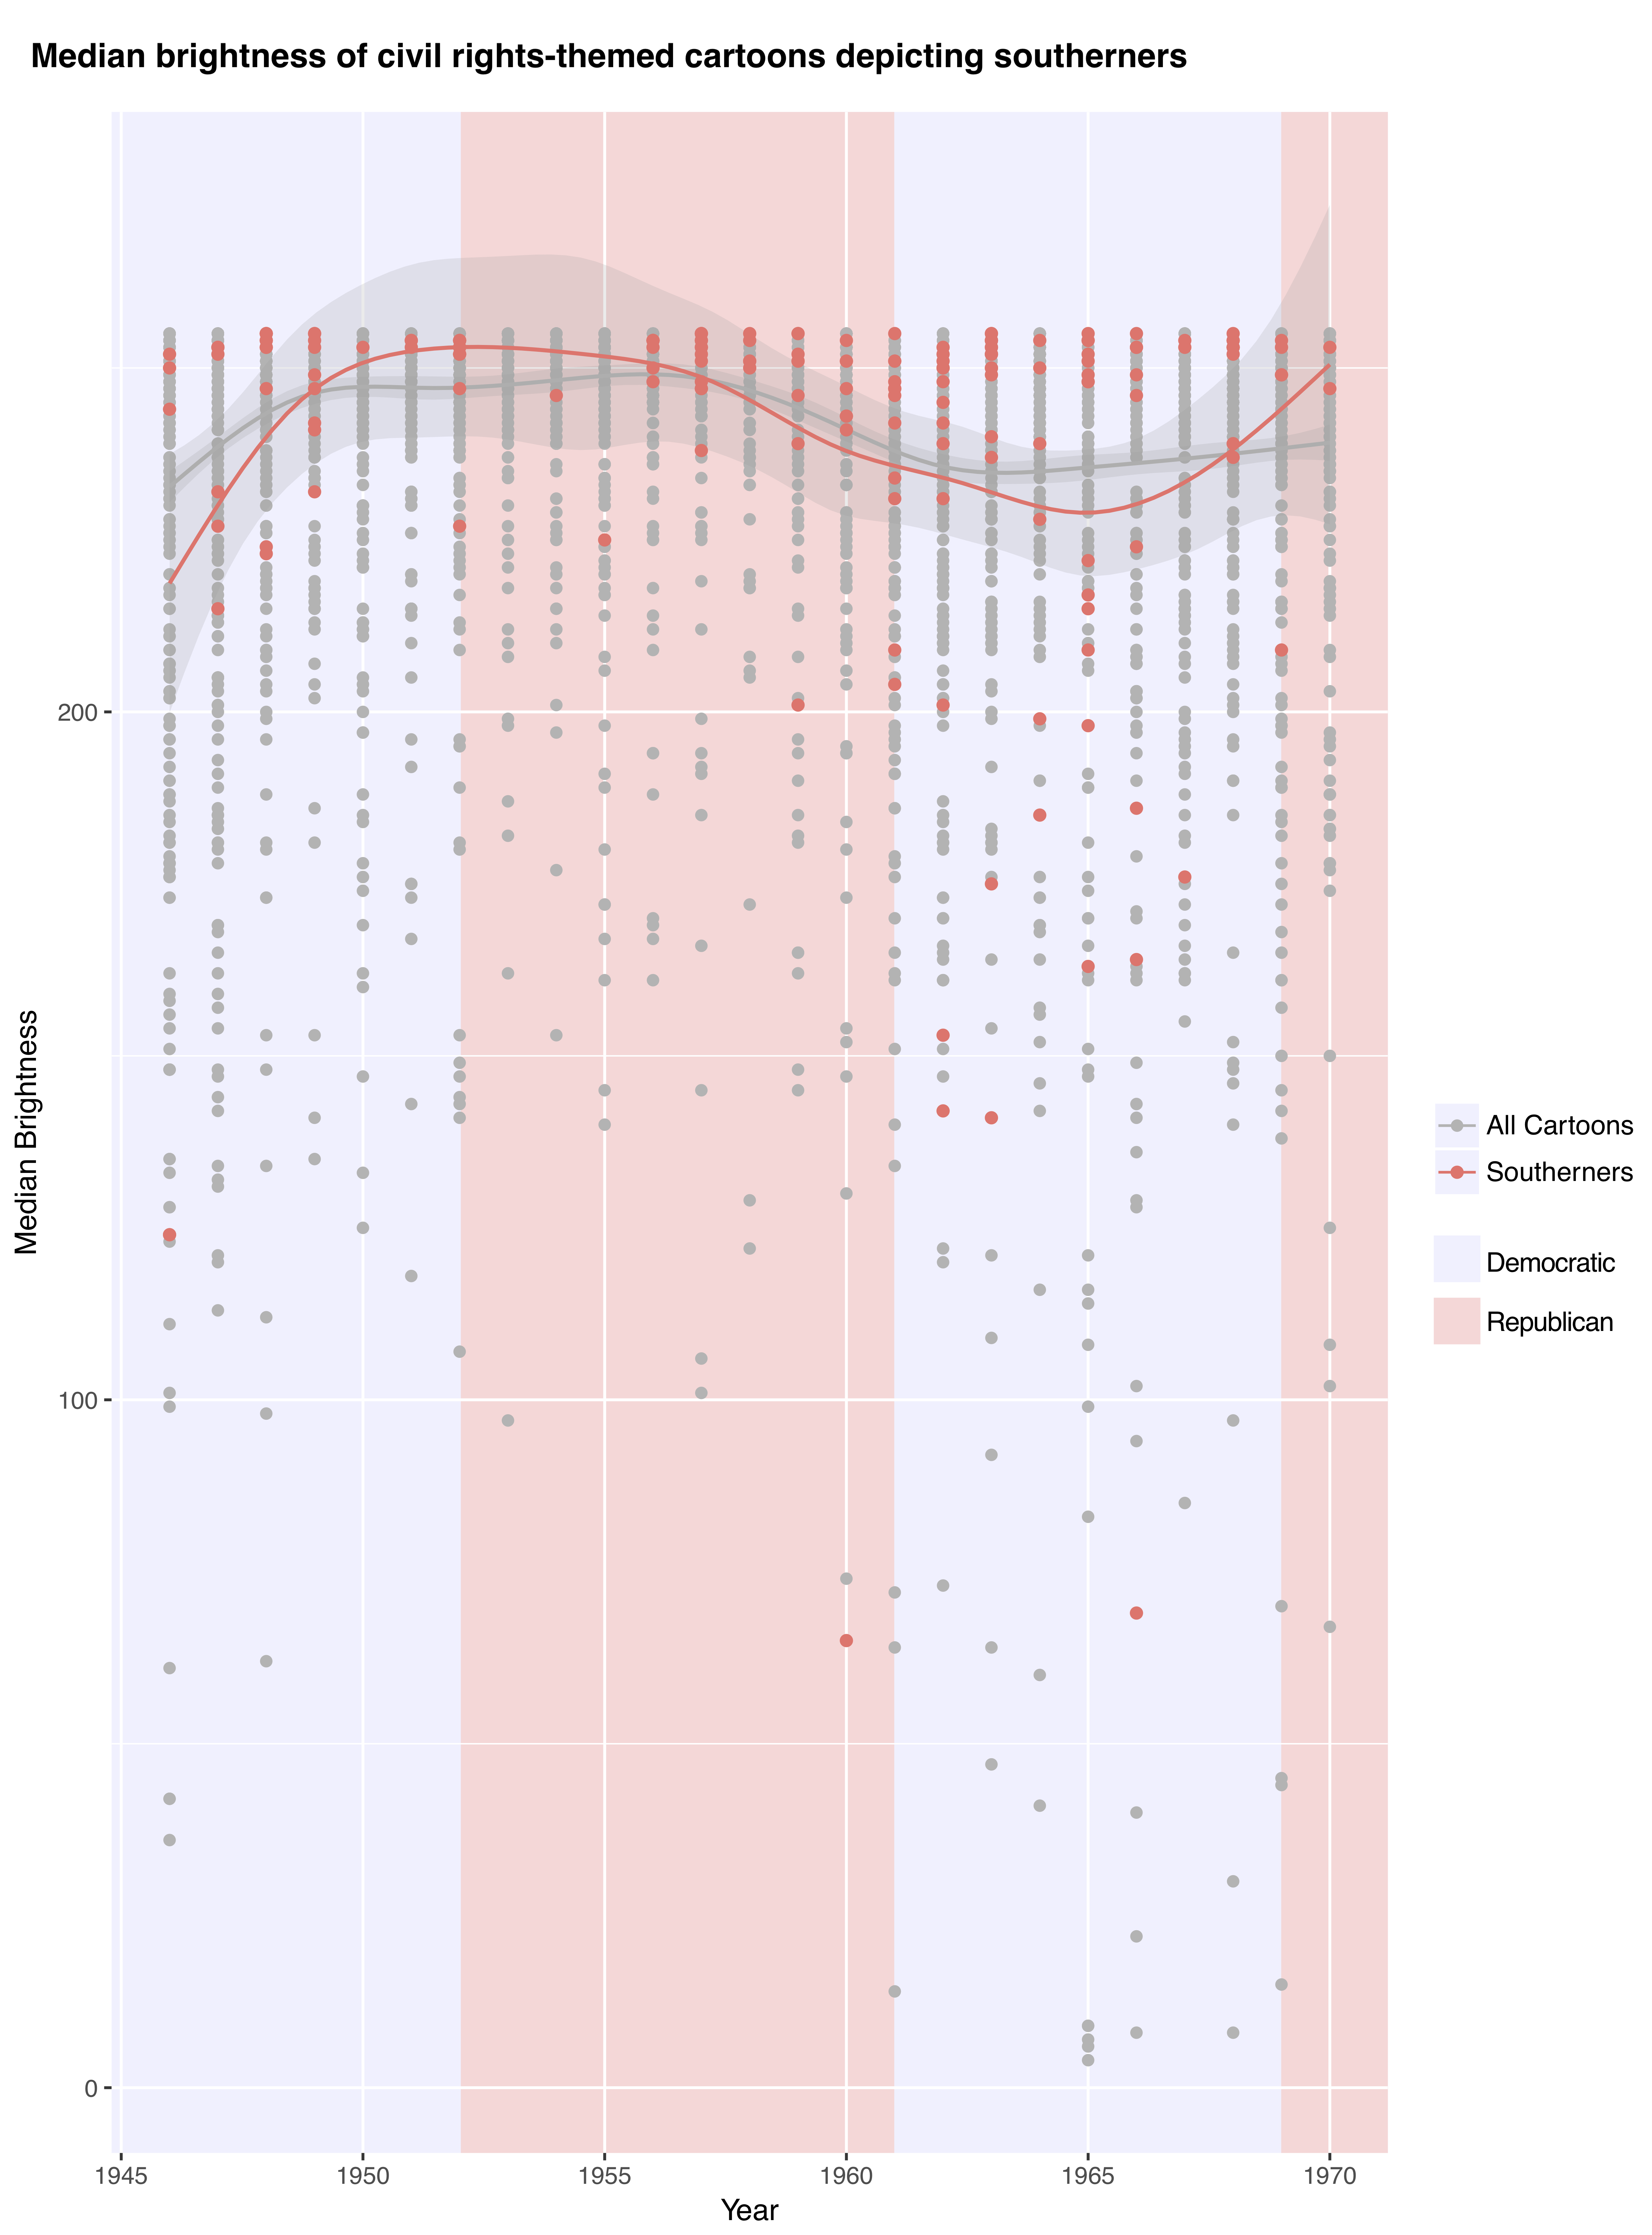
These results also suggest further avenues of research. A key question is to ask how the form of Block’s cartoons reflected his biases. In other words, while depicting, for example, the role of white southerners in civil rights, did Block also change—consciously or unconsciously—what he drew? One potential way of assessing this is to consider the use of contrast in his cartoons. Most of Block’s cartoons, as seen in the previous examples of his work, generally made use of a white (i.e. unprinted) background, which allowed his scenes and figures to stand out against the page. When Block made greater use of dark shading it was generally to suggest menace or danger. After calculating the median brightness of Block’s civil rights-related cartoons that include a depiction of a white southerner, we do find that, although the majority of these cartoons were predominantly white, Block was marginally more likely to make greater use of dark shading when depicting southerners than he was in the corpus as a whole (figure 6).
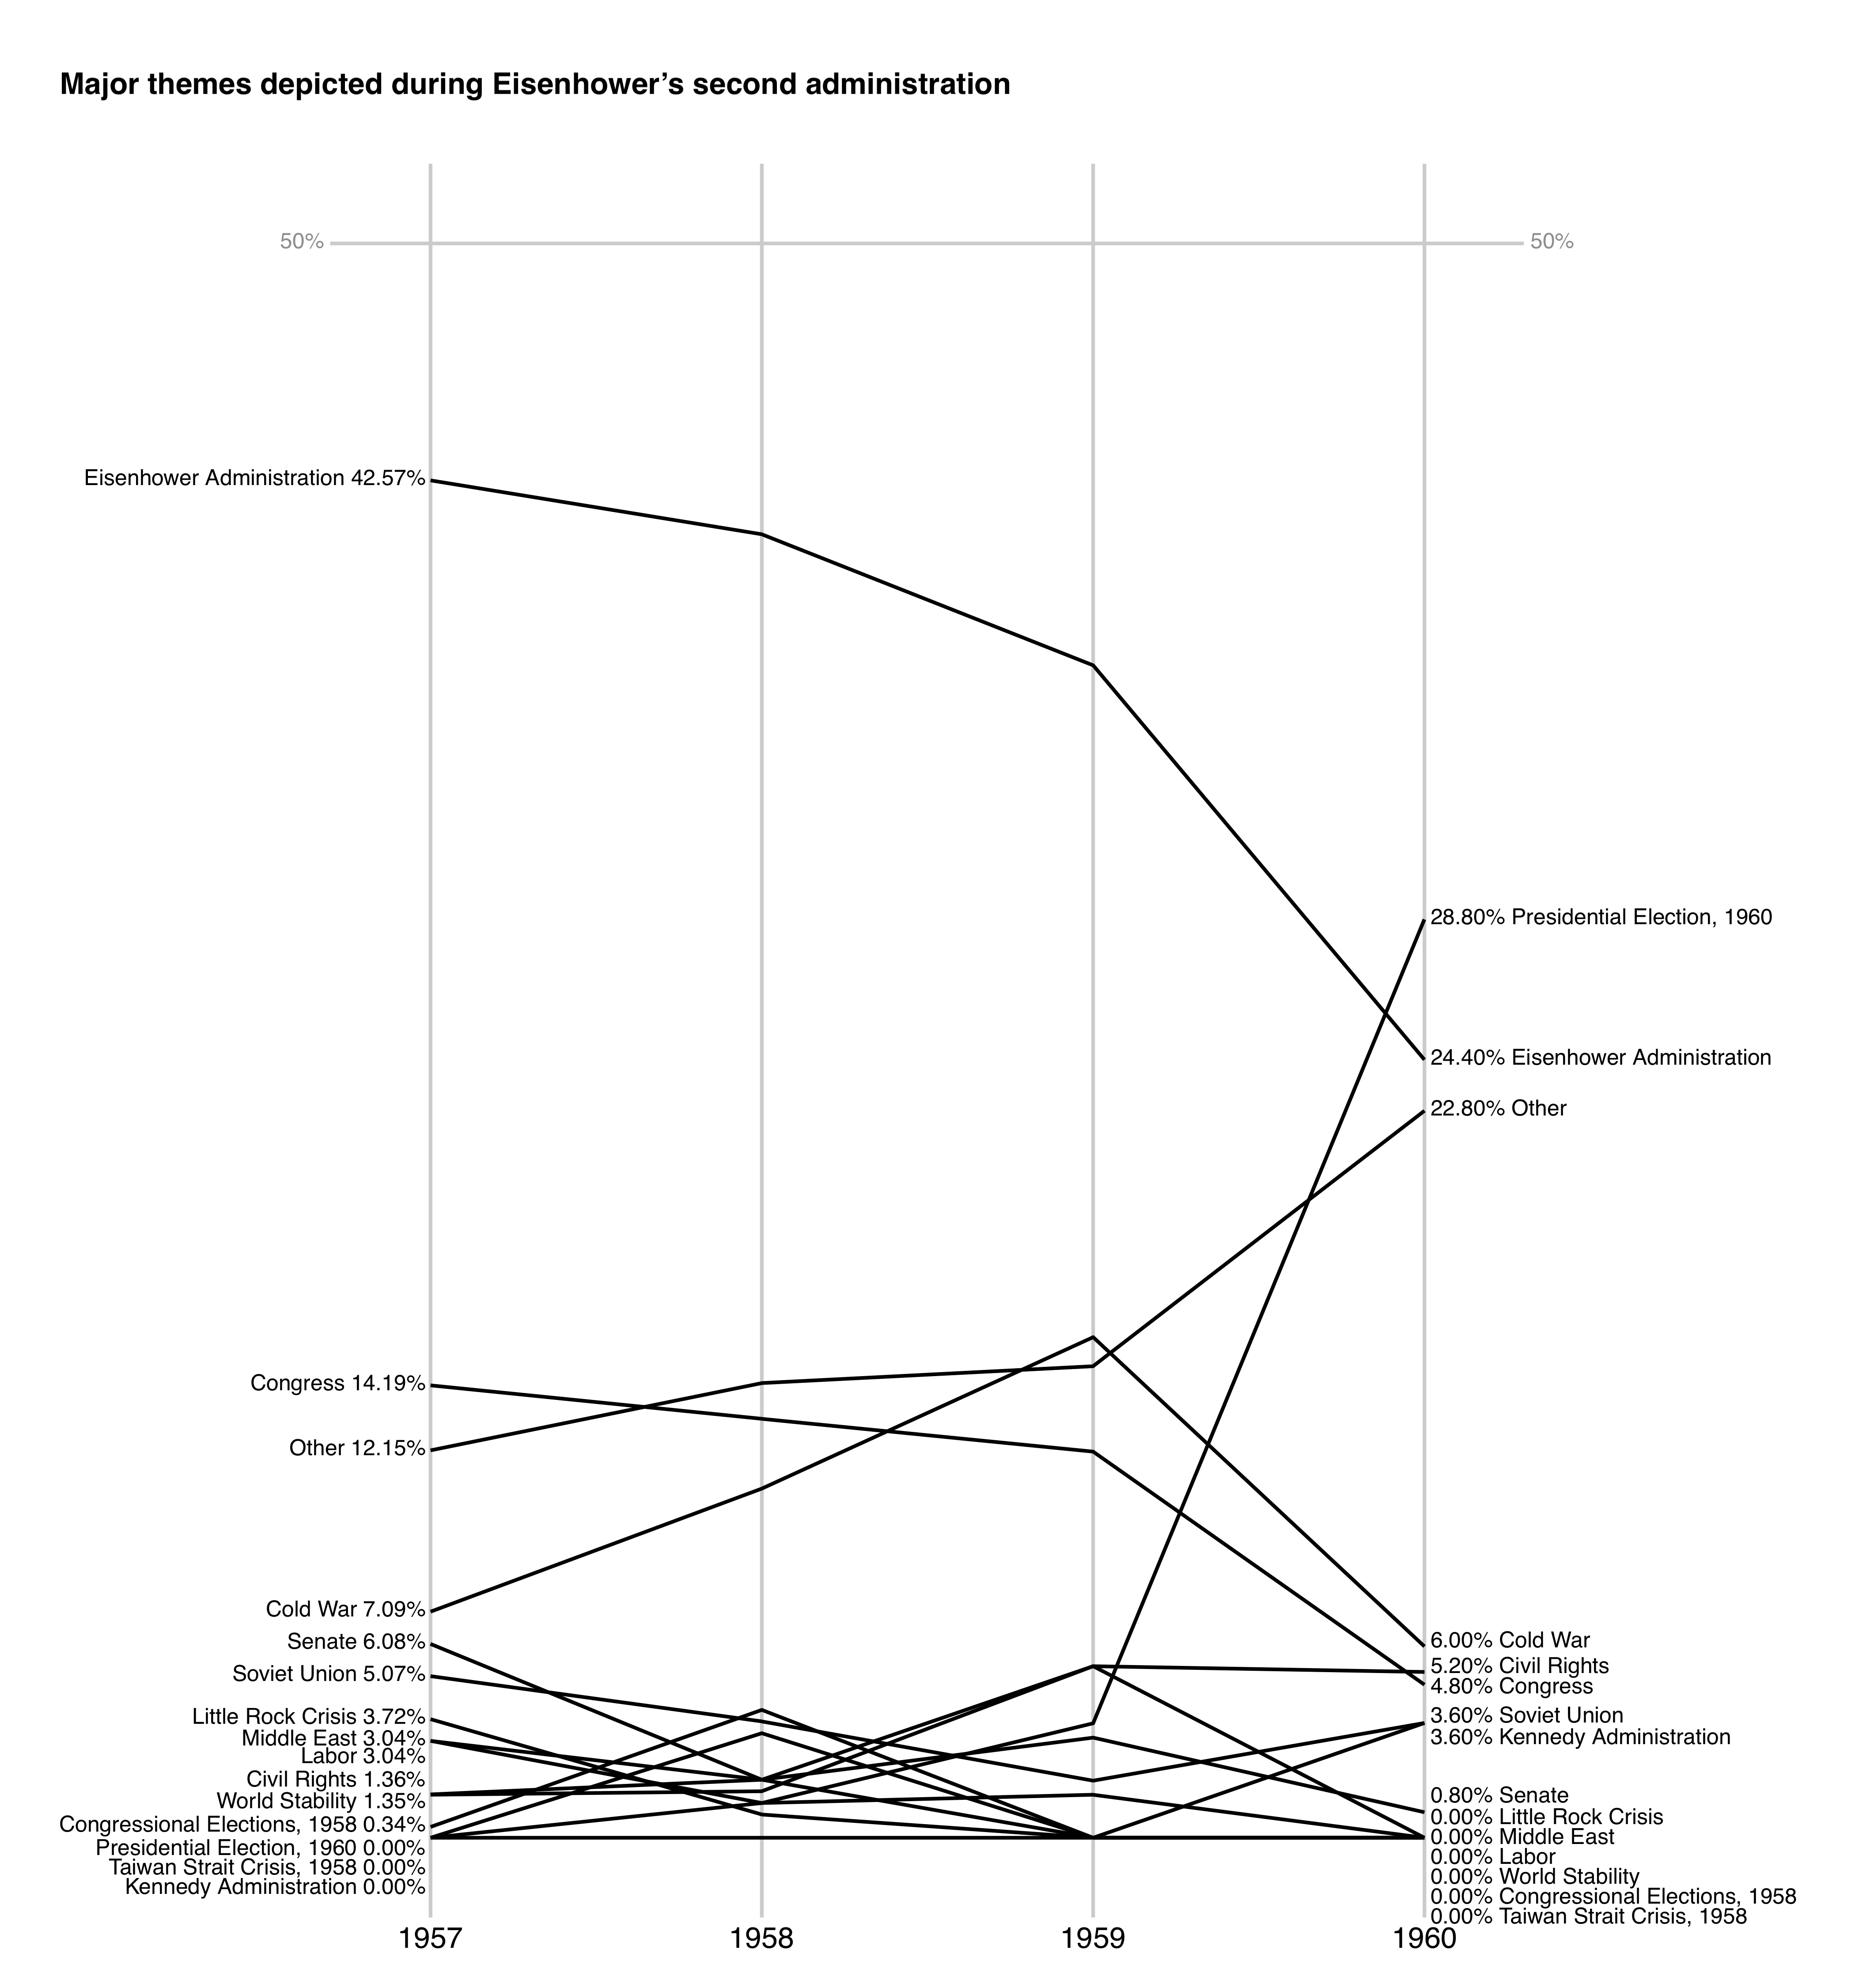
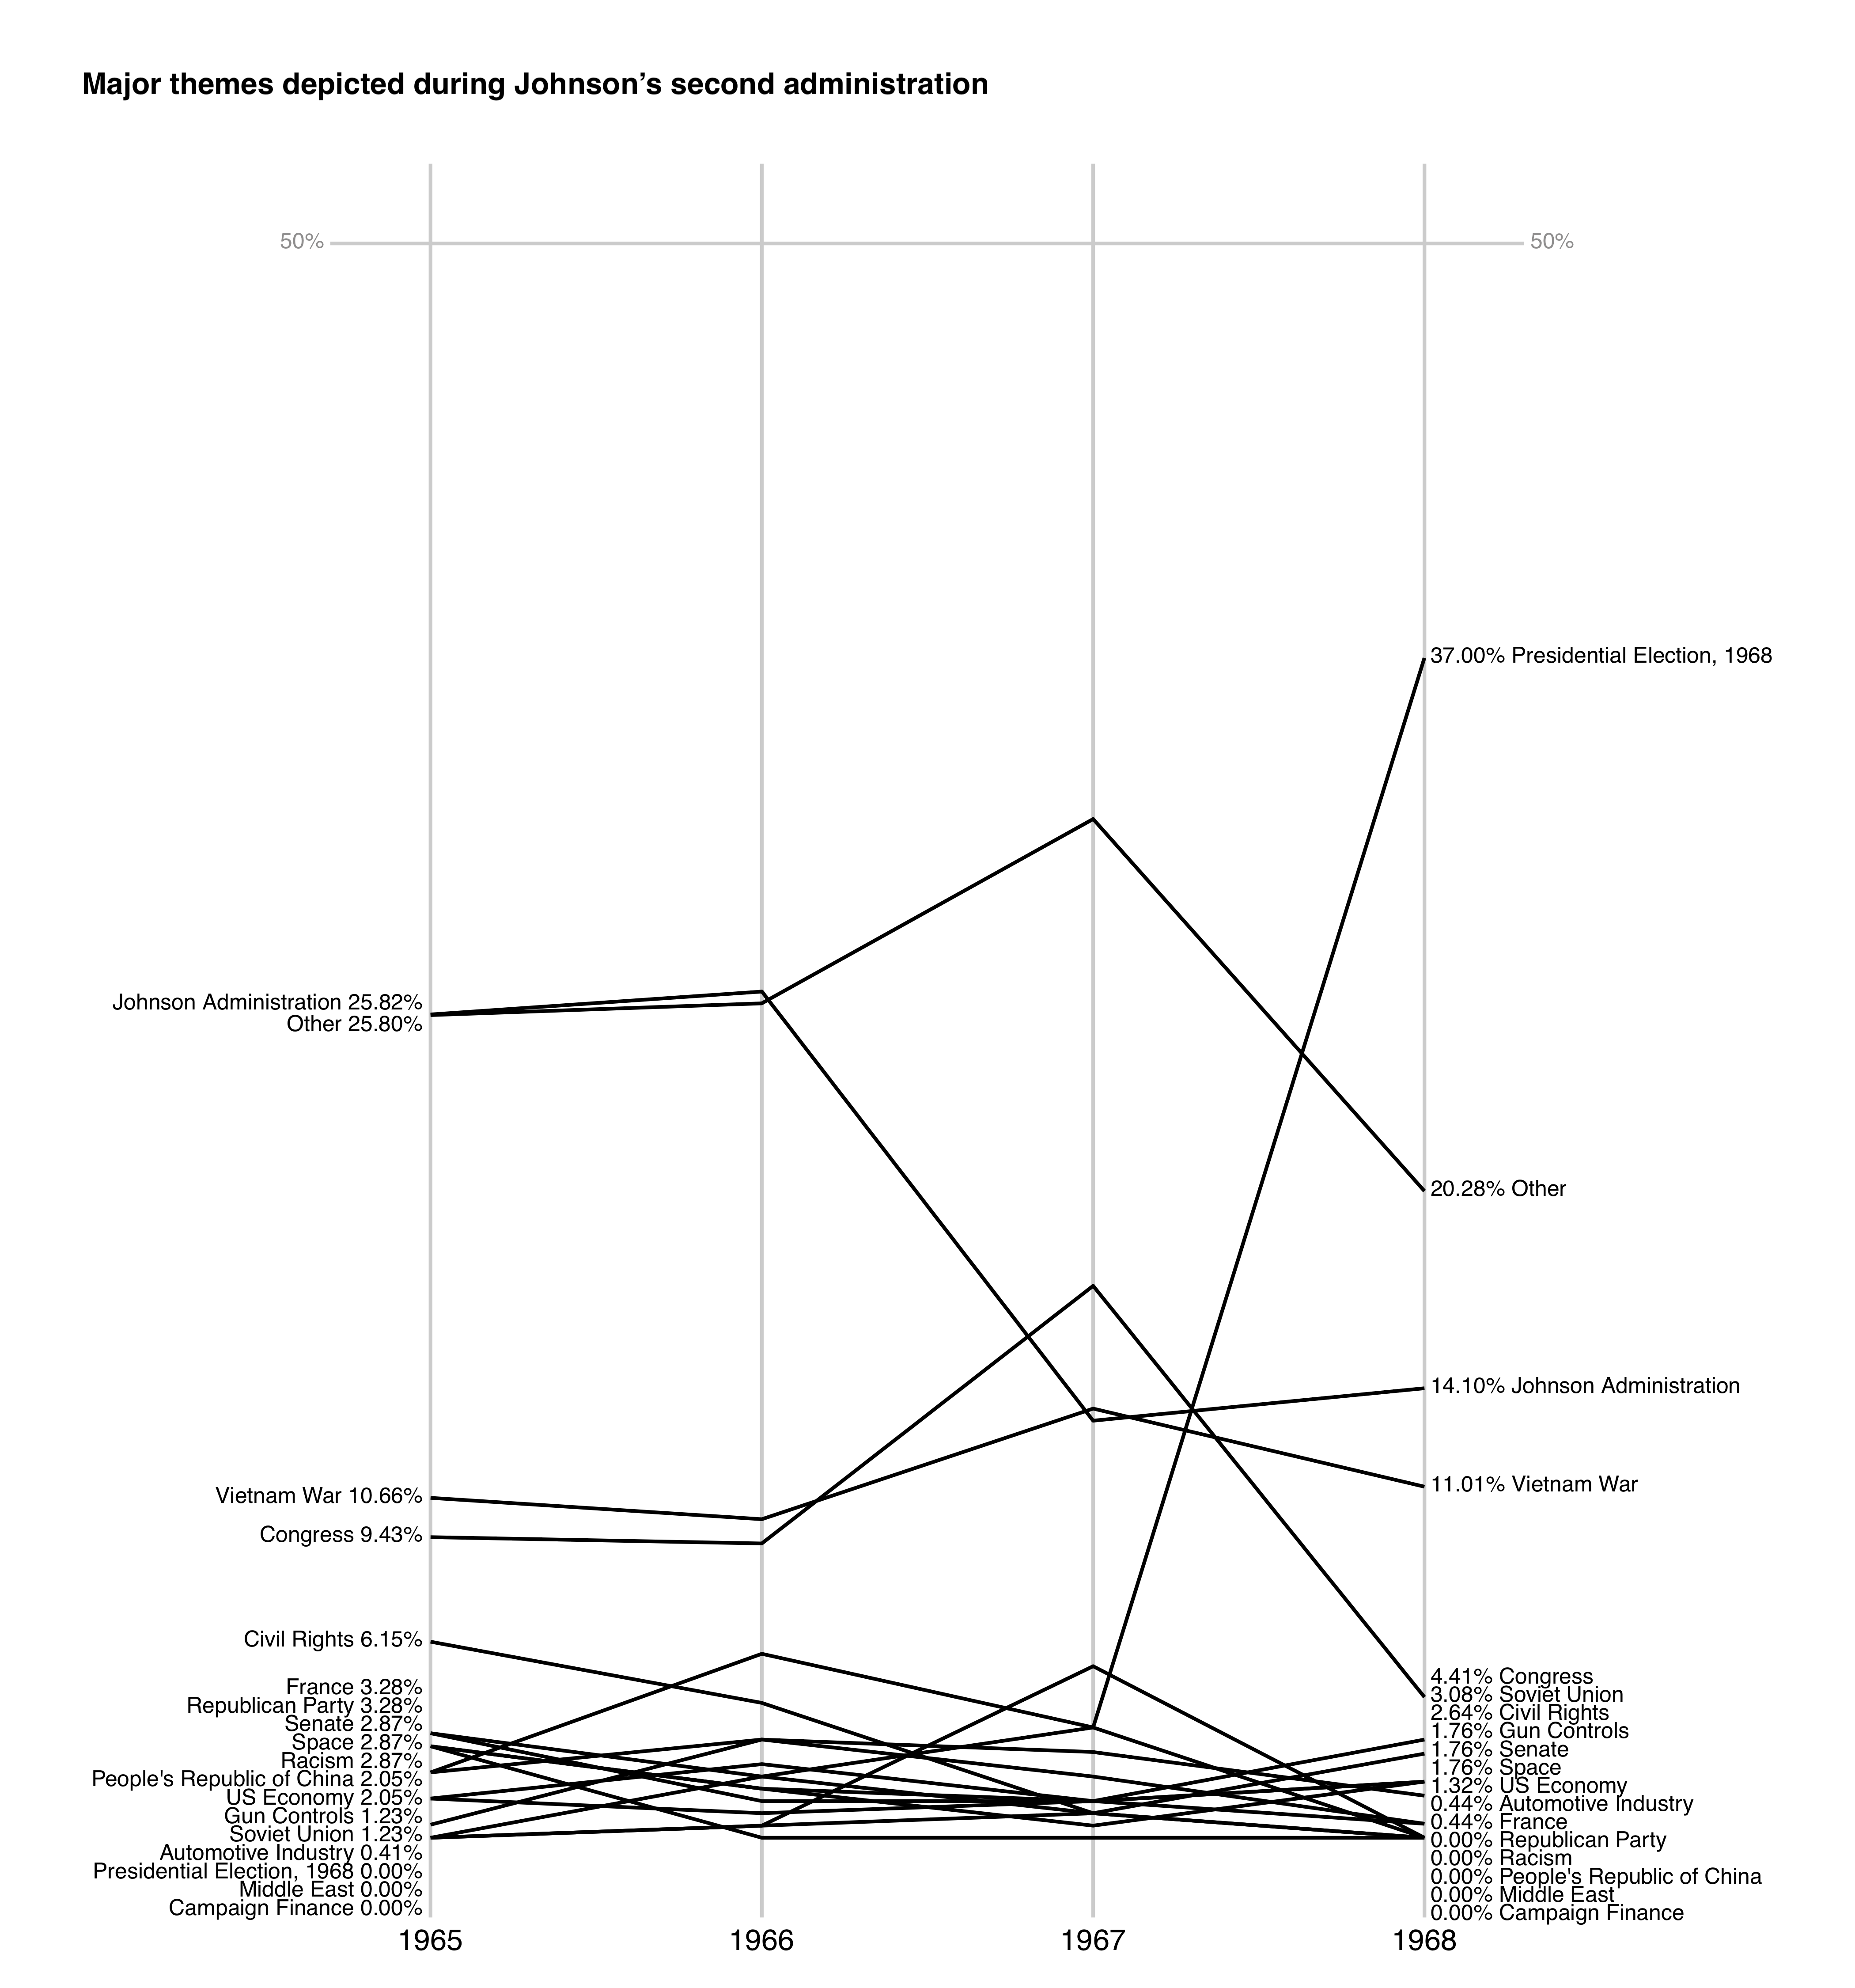
To better understand the context of these differences fully, figures 7 and 8 present slopegraphs that illustrate the major themes presented in the periods 1957–1960 and 1965–1968.10 Comparison of these figures reveal significant differences in how Block considered Democratic and Republican administrations. Most immediately obvious is the relative position and path of the “Eisenhower Administration” and “Johnson Administration” subjects. Whereas the former made up 42.57% of all cartoons in 1957 and only drops below a quarter of all cartoons in the election year of 1960, the proportion of cartoons depicting the Johnson Administration never rises above the 26.54% level seen in 1966. More notable are the differences between the paths of the “Other” line—that is, cartoons whose primary subjects were not drawn frequently enough to achieve 3% of the total output in any of the years depicted in the visualization. Between 1957 and 1960, this category never appears above the “Eisenhower Administration” category. In 1965, however, the “Other” category, is ranked behind the “Johnson Administration” subject by only 0.02% (or a single cartoon), and by 1967 is by far that year’s most common category, before dropping back down to the second most common category in 1968, when Block’s cartoons were heavily focused on the presidential election. The significance here is that the higher the value of the “Other” category, so too the greater diversity there is in the types of events and subjects that Block chose to depict and comment upon each year. Consequently, the trajectory of “Other” during Lyndon Johnson’s administration suggests that Block actively chose to draw cartoons focused on a wider variety of topics than he did during the second administration of Republican Dwight Eisenhower, this despite the fact that Block found himself increasingly disillusioned with Johnson’s administration.11
These results certainly seem to suggest that, at some level, Block chose his subject matter differently depending on which party held control of the White House. Despite his constant assurances to Henry Brandon and others, Block did not treat Republicans and Democrats in a substantially similar fashion. During the presidencies of Dwight Eisenhower and Richard Nixon, Block was especially focused on producing cartoons that responded to the specific policies and actions of those Republican administrations. In contrast, cartoons produced during the presidencies of Democrats were more varied in their focus and commented upon a broader range of topics and issues, indicating a reluctance on Block’s part to criticize the actions of these administrations and negating his claims of “independence.”
Bibliography
Anderson, Benedict. Imagined Communities: Reflections on the Origin and Spread of Nationalism. London: Verso, 1991.
Block, Herbert. Herbert Block Papers, Manuscript Division, Library of Congress, Washington, D.C.
Block, Herbert. Herblock: A Cartoonist’s Life. New York: Macmillan, 1993.
Block, Herbert. “Reveille.” Washington Post, April 11, 1951, 10.
Block, Herbert. “Whence All But He Had Fled.” Washington Post, June 10, 1957, A12.
Brandon, Henry. As We Are. New York: Doubleday, 1961.
Drucker, Johanna. “Not Sound.” In The Sound of Poetry / the Poetry of Sound, edited by Marjorie Perloff and Craig Dworkin, 237–48. Chicago: University of Chicago Press, 2009.
Manovich, Lev, Jeremy Douglass, Jay Chow, Matias Giachino, and Nadia Xiangfei Zeng. “ImageMeasure.” ImageJ macro version 1.1. 2012. http://lab.softwarestudies.com/p/imageplot.html .
R Core Team. “R: A language and environment for statistical computing.” R Foundation for Statistical Computing, Vienna, Austria.2016. https://www.R-project.org/ .
Wickham, Hadley, and Winston Chang. “ggplot2: An Implementation of the Grammar of Graphics.” R package version 2.2.1. 2016. https://CRAN.R-project.org/package=ggplot2 .
Notes
Arthur M. Schlesinger Jr. to Herbert Block, March 1, 1951, in Herbert Block Papers, Manuscript Division, Library of Congress, Washington, DC (hereafter Block Papers), box 70, folder 7.
Chester Bowles to Herbert Block, March 5, 1951, Block Papers, box 7, folder 4.
To calculate these totals, a cartoon is only counted once for each party regardless of the number of Democrats or Republicans it depicts. People were designated as Democrat or Republican based on their publicly stated political affiliation at the time Block drew them. Changes in party affiliation are thus reflected in these totals. For example, the one 1948 depiction of Strom Thurmond is counted as representing the Dixiecrats, after which he is counted as a Democrat (four cartoons) until he formally changed his party affiliation in 1964 from which point his twelve appearances count towards the Republican total. These totals also include characters that were clearly intended to represent a specific political ideology by being either labeled “Republican”/“Democrat”, drawn as the Republican Elephant or Democrat Donkey, or clearly depicted in a situation that indicates their party affiliation, for example with cartoons that depict the Republican or Democratic National Conventions.
Specifically, we are using the Pearson correlation coefficient formula, which takes the covariance of two variables divided by the product of their standard deviations.
Each chart only plots a specific subject if it is the major topic for at least 3% of Block’s output in one of the years visualized; other subjects are grouped together in the category “Other.” For example, in Figure 8, the subject “Middle East” appears in none of the cartoons Block drew in either 1965 or 1968, but does appear in 5.38% of his output for 1967 and consequently is found on the chart. The inclusion of the “Other” category is important as it indicates the variety of major subjects that Block’s cartoons dealt with each year, without adding additional clutter to the visualizations.
Appendices
Author
Simon Appleford,
Department of History, Creighton University, simonappleford@creighton.edu, 0000-0003-2192-7860